

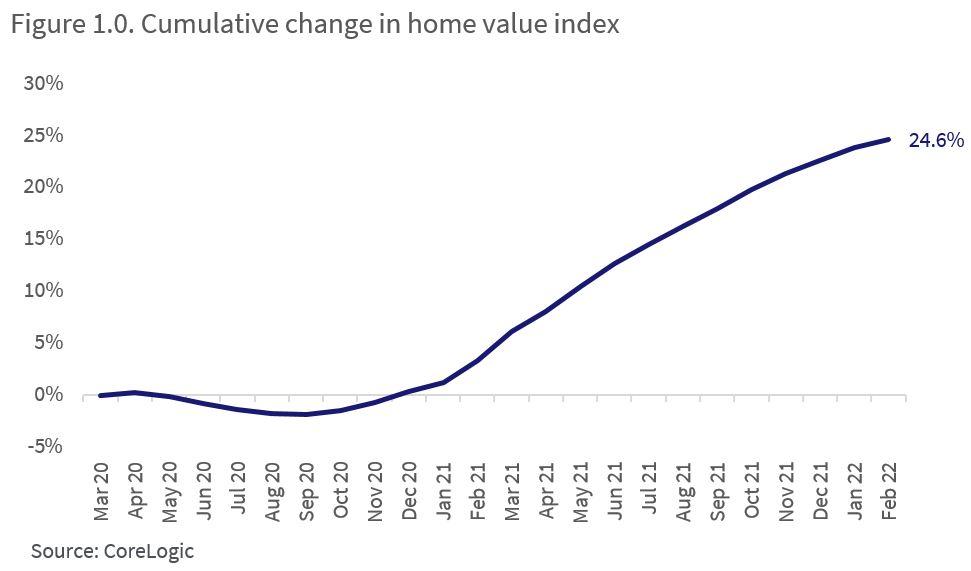
1. Australian home values rose 25%, to record highs.
Despite an initial dip, housing values rose 24.6% between the end of March 2020 and February 2022. Figure 1.0 shows the cumulative change in the national CoreLogic Home Value Index since the onset of COVID-19. The index had a relatively small decline at the onset of COVID-19, with sales and listings volumes being far more impacted than prices. National home values declined -2.1% between April 2020 and September 2020, before soaring amid low interest rates, high household savings, government grants and a sharp reduction in the supply of housing.
2. First homebuyer activity spiked.
ABS data shows the number of new loans to first homebuyers increasing during the housing market downswing from 2017 to 2019 (figure 2.0). From June 2020, first home buyer activity surged amid the introduction of the HomeBuilder scheme, used alongside the First Home Loan Deposit Scheme, as well as other state-based grants and stamp duty concessions for first homebuyers.
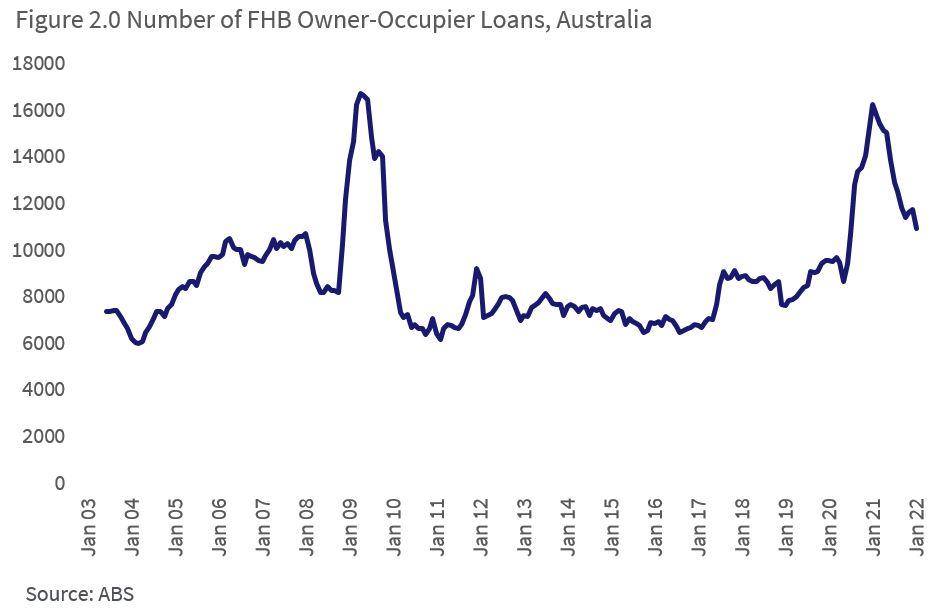
As of January 2022, loans to first homebuyers numbered 10,964, above the decade average of 8,682. Proportionally, first homebuyer lending comprised 24% of owner occupier mortgage demand in January, which is in-line with the decade average.
3. Rents rose 11.8% to record highs, while gross yields fell to record lows.
Figure 3.0 shows the change in the national rent index since the end of March 2020. While rents saw a mild decline of -0.8% between March and August 2020, there was a swift recovery in these values, followed by a surge through 2021.
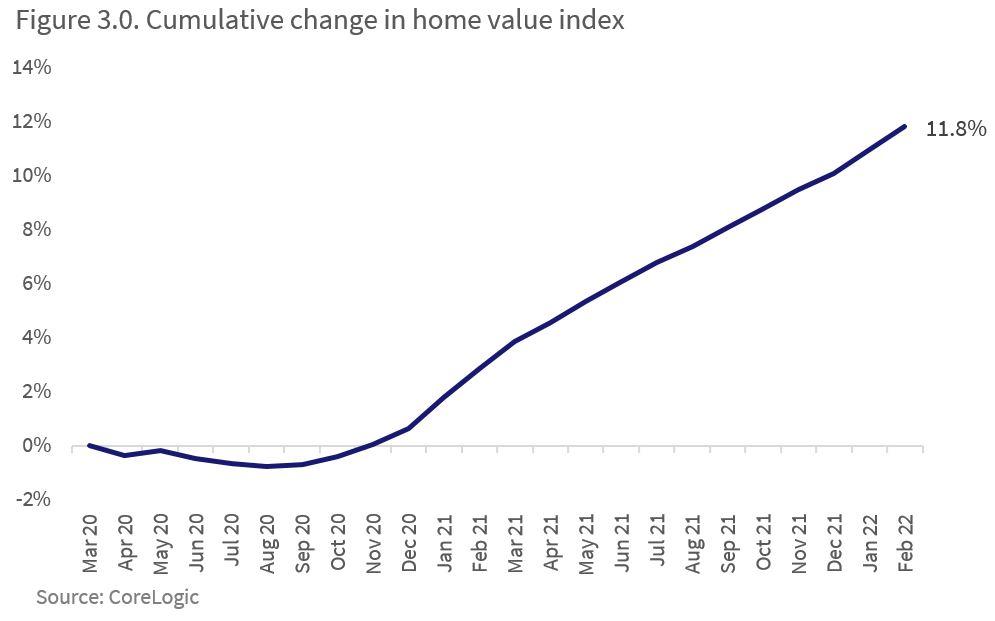
Over the course of 2021, annual rent value growth was at its highest levels since 2008. Across Australia, median advertised rents since March 2020 have increased $30 per week to $470 per week. The headline numbers hide the diversity of rental conditions. Through the pandemic, there has been a clear shift in rental preferences towards lower density housing options, where the upwards pressure on rents has been more substantial. This trend has evolved over the past year, with rental affordability gradually deflecting more demand towards higher density rental options where the cost of renting is more affordable.
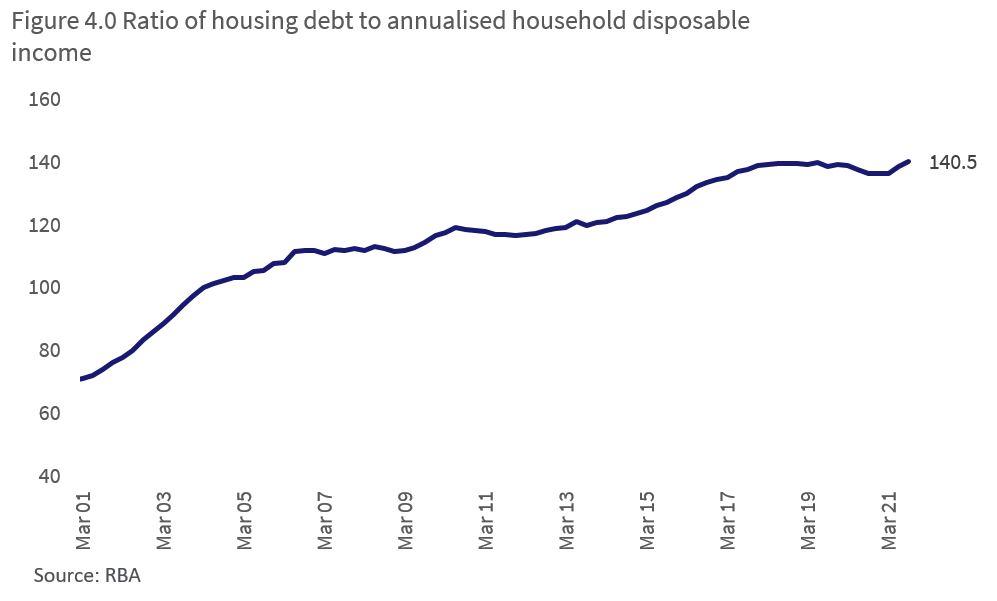
4. Housing debt levels hit record highs.
Rapid increases in housing and rent values in the past two years was largely the result of a sizable reduction in the official cash rate. With the RBA setting the official cash rate target at 0.1% since November 2020, lower debt costs enabled borrowers to access more credit.
As of January, total outstanding housing credit sat at a record high of over $2 trillion, according to the RBA, while the ratio of housing debt to household income was at a record high 140.5% through Q3 2021 (figure 4.0). This is up from 139.2% in March 2020.
While total outstanding credit reached over $2 trillion in January, ABS data shows monthly new finance borrowed for the purchase of property continued to hit fresh record highs through January 2022, at $33.7 billion.
5. The premium of house prices compared to units hit record highs.
Figure 5.0 shows the median house value across Australia was at a record high 29.8% above the median Australian unit value, with a dollar value premium of around $182,000. This is up from just 8.5% in March 2020, or a dollar value premium of around $44,000 for houses.
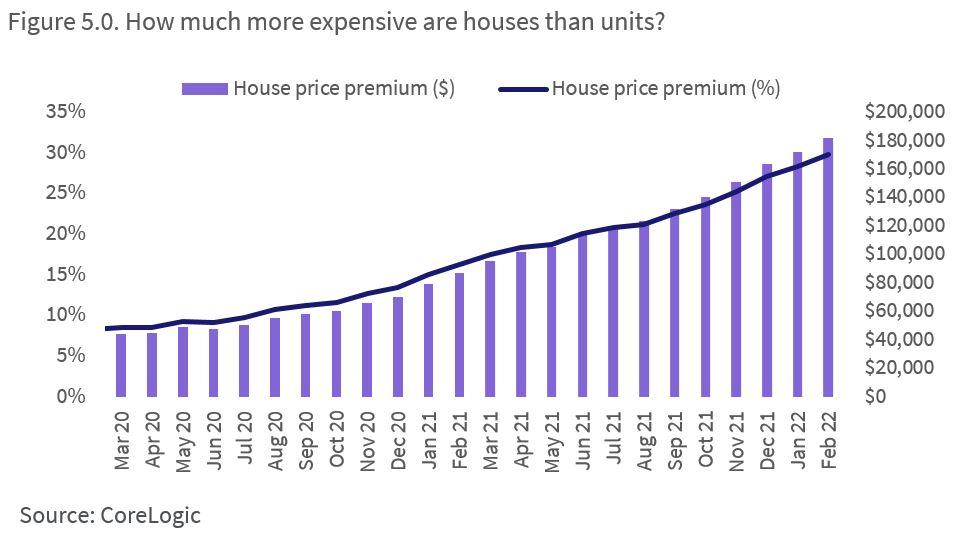
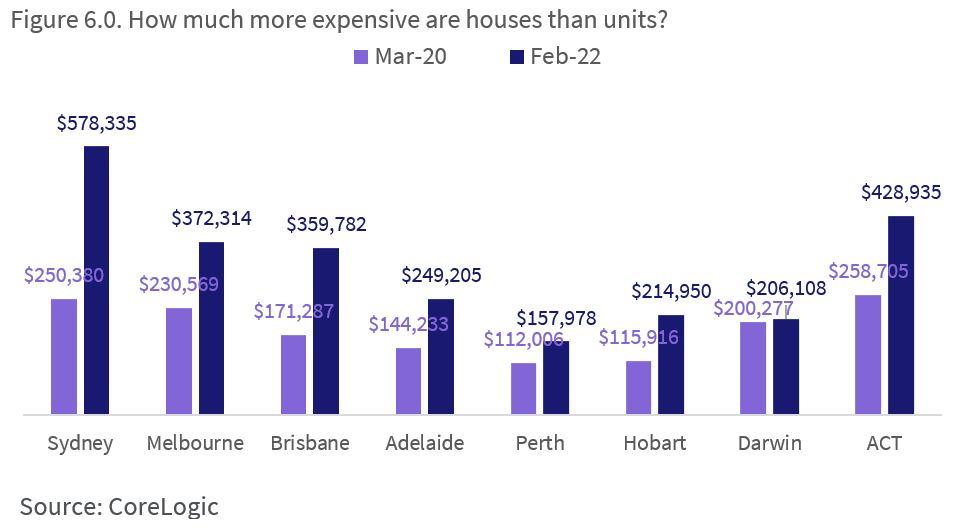
Figure 6.0 shows the dollar-value premium of median house values over median unit values in each of the capital cities, with most cities seeing a substantial increase in this value since March 2020.
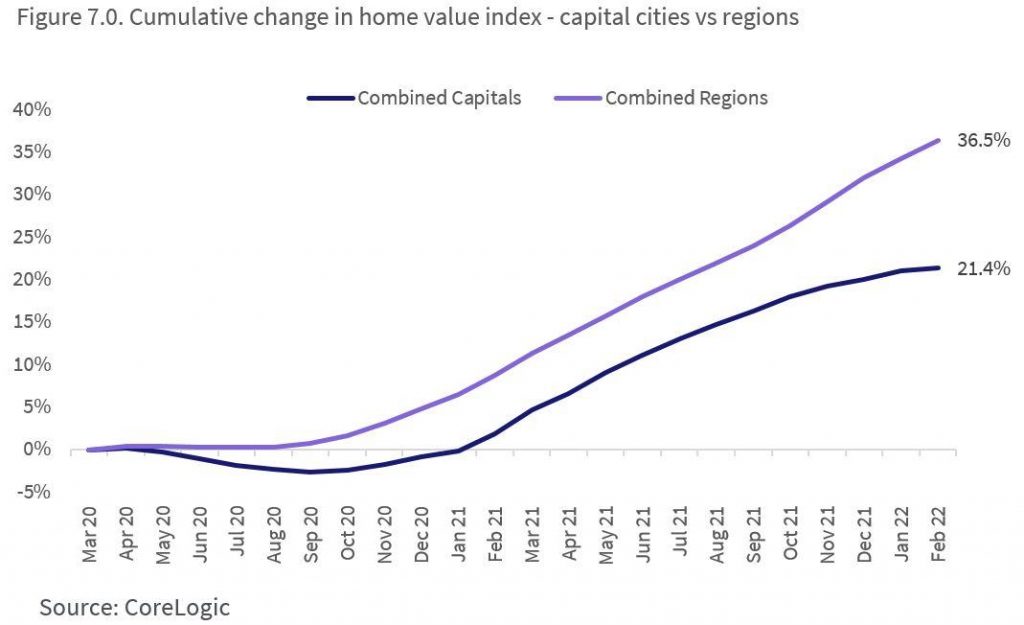
6. The rise of the regions.
Migration trends over 2020 and 2021 revealed an uptick in the volume of people leaving cities for regions outside of lockdown periods, and a decline in people leaving regions for cities.
The result has been higher than normal housing demand against unusually low levels of listings across regional Australia, in both the sales and rental market. Value gains across regional Australian dwelling values has been almost 40% since March 2020, while capital city home values have increased around 21% (figure 7.0).
Source: https://www.corelogic.com.au/news/two-years-six-ways-covid-19-has-shaped-housing-market