Core Logic Research News • 22 May 2023
What will the impact of rising demand have on listings, given we anticipate advertised supply to remain relatively low compared to historic averages?
- Housing supply in the form of properties for sale will largely depend on whether home values are rising or falling.
- If home values continue to rise at the same pace observed through March and April, historic analysis suggests a 2% bump in new listings this calendar year.
- New listings may rise irrespective of capital growth performance if there is a substantial deterioration in mortgage serviceability, but this is unlikely.
Demand for dwellings has seen an impressive lift in the past two months. Evidence of this can be seen through increases in the CoreLogic Home Value Index, higher auction clearance rates, and a rise in the number and value of housing finance commitments reported by the ABS.
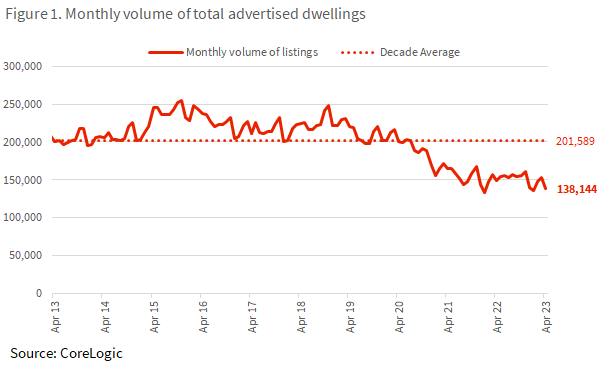
The total volume of dwellings for sale in Australia has been trending lower since the onset of COVID-19 restrictions in 2020. As of April 2023, there were 138,144 listings observed over the month, which is near decade-lows. Total listings were -31.5% below the decade monthly average, and -33.8% below the average for April.

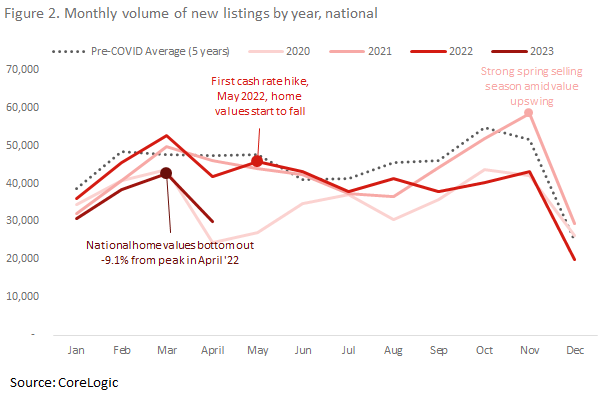
Over the course of the past three years, total stock for sale has been impacted by different factors. Between late 2020 and April 2022, available stock for sale was depleted via a rapid rate of absorption. Homes sold quickly amid low interest rates and a surge in buyer demand. During this time, there was an elevated volume of new listings being added to the market (as shown in Figure 2), but strong selling conditions meant properties were typically selling within 27 days¹.
Conversely, low listings in the past 12 months have been the result of a slowdown in the flow of new listings, where prospective vendors may be resisting selling amid lower home values compared to early 2022.
Figure 2 shows different periods of new listings added to the market on a monthly basis. It covers a period of four years and the dotted line gives us insight into the historic monthly average. The chart suggests the number of new listings has been responsive to changes in home values, as well as events that have influenced home values, such as the start of the pandemic and changes in interest rates. As the market has higher rates of growth, the number of vendors who decide to sell increases. On the contrary, as the market moves into a downswing, sellers hold off.
As national home values bottomed out in March 2023, the volume of new listings was even lower than at the onset of the pandemic in March 2020, and 10.0% below the previous five-year average.

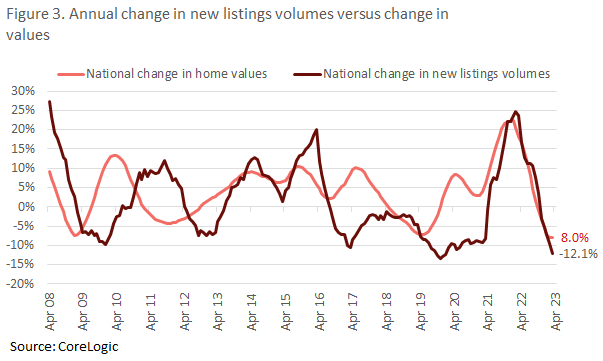
Figure 3 shows a long-term relationship between growth in dwelling values and new listings decisions. The chart plots the rolling annual growth in the CoreLogic Home Value Index for dwellings nationally, against rolling annual growth in new listings. At a high level, simple linear regression analysis suggests that for every 1% increase in property values over the year, there is a 0.5% increase in new listings in the same period.
The listings outlook for 2023
The outlook for new listings should, to a large extent, be determined by capital growth performance in home values. Going by the historic average, if national home values continue on the current trajectory through to the end of the year, that is rising at half a percent per month (as recorded in March and April), home values would end the year around 4.1% higher.
This would equate to an increase in 2023 listings that was 2% higher when compared to 2022. An additional 2% on the 485,052 new listings over 2022, would equate to 494,753 listings over 2023.
Given 2022 saw a fairly lack-lustre spring selling season, a continuation of recent capital growth could see higher volumes in the second half of this year than last year.
However, the assumption of 4.1% capital growth this year is a highly uncertain one. It is early in the recovery phase of the home value cycle, and there is no guarantee that the capital growth trend of recent weeks will continue. There is still some uncertainty around the trajectory for the cash rate, particularly given the latest monetary policy announcement showing a tightening bias from the Reserve Bank.

Alternatively, there is a scenario that presents an upside risk for new listings. This would be a situation where vendors may need to sell their home and not voluntarily. This may include households struggling to service a mortgage at higher interest rates, particularly amid rising unemployment over the course of the year. However, this scenario seems unlikely at present, given the low volume of new listings to date through rate rises, and strong pre-payment buffers across mortgaged households.

